
This article covers the metrics currently included on the Analytics page of Ascend HQ.
Note: All metrics measure finished (closed) transactions only and exclude tax. Sales with no sales items (e.g. gift card/gift certificate sales) are excluded from calculations.
Mini Metrics
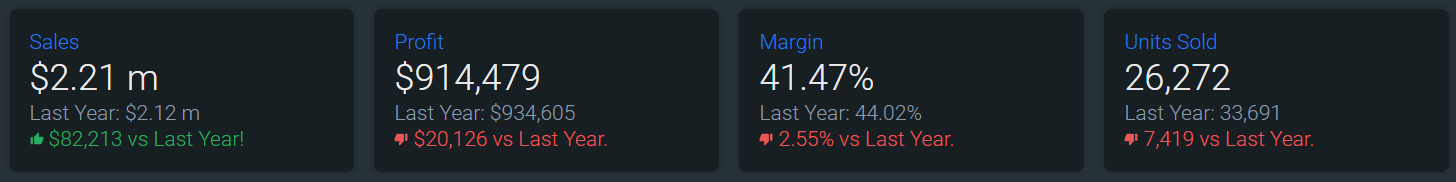
- Sales = Sales Dollars
- Profit = Sales minus Cost of Goods Sold
- Margin = (Profit / Sales) * 100 displayed as a percentage
- Units Sold = Quantity of Items Sold
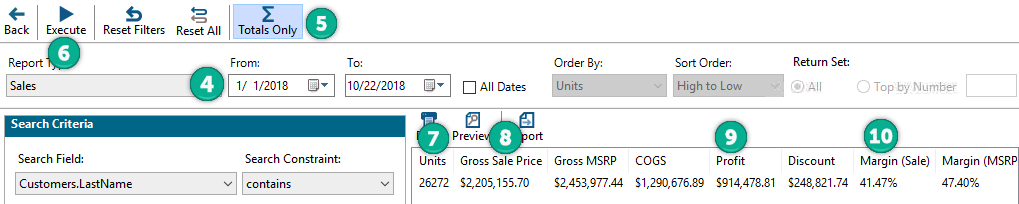
To verify these numbers in Ascend, do the following:
- In Ascend HQ, select a single location
- Set the Date Range to Year to Date
- In Ascend, go to Reports and click Prod. Query on the toolbar
- Set your From date to the first day of the calendar year
- Click the Totals Only button on the toolbar
- Click Execute to run the Query
- Units should equal Units Sold in Ascend HQ
- Gross Sale Price should equal Sales in Ascend HQ
- Profit should equal Profit in Ascend HQ
- Margin (Sale) should equal Margin in Ascend HQ
Mountain Metrics
Retail Profit Machine (RPM)
Note: Values are color-coded according to their score – green indicates exceptional performance, blue indicates adequate performance, and orange indicates performance which needs improvement. Click the toggle button (double square icon) to display the minimum target value for each score.
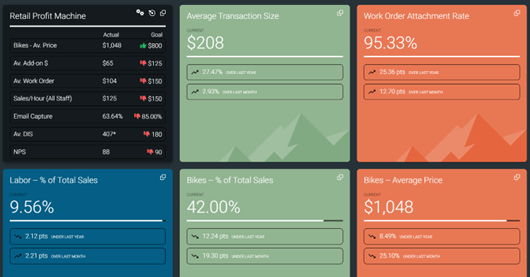
- Bikes – Av. Price: Total value (sales dollars, excluding tax) divided by total quantity of sales items which were finished (closed) in the selected date range and which are assigned to a Bikes category (i.e. top parent category contains Bikes or Bicycles).
-
Av. Add-on $:Total value (sales dollars, excluding tax) of sales items which were finished (closed) in the selected date range divided by total quantity of sales items which were finished (closed) in the selected date range
- Total value (sales dollars, excluding tax) of sales items which were finished (closed) in the selected date range
- Which are not assigned to a Bikes category (i.e. top parent category contains Bikes or Bicycles),
- Which are not assigned to a serialized category, and
- Which are not assigned to a Labor category (i.e. top parent category contains Labor or Labour)
- Divided by total quantity of sales items which were finished (closed) in the selected date range
- Which are not assigned to a Bikes category (i.e. top parent category contains Bikes or Bicycles),
- Which are not assigned to a serialized category, and
- Which are not assigned to a Labor category (i.e. top parent category contains Labor or Labour).
- Total value (sales dollars, excluding tax) of sales items which were finished (closed) in the selected date range
-
Av. Work Order: For Work Order Details which are completed and whose transaction was finished (closed) in the selected date range:
- Total value (sales dollars, excluding tax) of sales items which were added to a Work Order Detail and
- Which are not assigned to a Bikes category (i.e. top parent category contains Bikes or Bicycles),
- Which are not assigned to a serialized category,
- Which are not assigned to a Rental category (i.e. top parent category contains Rental), and
- Which are assigned to a category divided by the total number of Work Order Details.
- Total value (sales dollars, excluding tax) of sales items which were added to a Work Order Detail and
To verify this number, run the following query in Ascend. Be sure to enter the date range that equals what you're looking at in Ascend HQ.
--Average Work Order
WITH WorkOrderSales
AS
(SELECT
SUM(Si.Quantity * Si.Price) AS [WOSales]
FROM Sales S
JOIN SalesItems Si
ON S.ID = Si.SalesID
JOIN WorkOrderDetails WO
ON Si.WorkOrderDetailID = WO.ID
WHERE S.Hide = 0
AND Si.Hide = 0
AND WO.DateCompleted IS NOT NULL
AND Si.RentalReservationID IS NULL
AND Si.ProductID IN (SELECT
ID
FROM Products
WHERE TopicID IS NOT NULL
and topicid not in (select id from Categories where Serialized = 1 )
AND Si.SerialID IS NULL
AND S.FinishDate BETWEEN <<StartDate>> AND <<EndDate>>
)),
WOCount
AS
(SELECT
COUNT(DISTINCT Si.WorkOrderDetailID) AS [WOCount]
FROM Sales S
JOIN SalesItems Si
ON S.ID = Si.SalesID
JOIN WorkOrderDetails WO
ON Si.WorkOrderDetailID = WO.ID
WHERE S.Hide = 0
AND Si.Hide = 0
AND WO.DateCompleted IS NOT NULL
AND Si.RentalReservationID IS NULL
AND Si.SerialID IS NULL
AND S.FinishDate BETWEEN <<StartDate>> AND <<EndDate>>
),
Results
AS
(SELECT
WorkOrderSales.WOSales
,WOCount.WOCount
FROM WorkOrderSales
,WOCount)
SELECT
[Avg Work Order] =
CASE
WHEN R.WOSales = 0 THEN 0
WHEN R.WOCount = 0 THEN 0
ELSE R.WOSales / R.WOCount
END
FROM Results R
-
Sales/Hour: Total value (sales dollars, excluding tax) of transactions finished (closed) divided by total hours worked (as recorded in Ascend’s Time Clock) by all users.
- Note: This number will differ slightly from Sales per hour in the sales team analysis because sales team analysis excludes the hours of technicians and employees who have not created a transaction during the day.
- Email Capture: Percent of total transactions for the store with a customer associated who has an email address entered which were finished (closed) in the selected date range.
-
Av. DIS: The estimated number of days products have been in stock without selling. Total number of days in the selected date range divided by the number of turns (total inventory difference – beginning inventory value minus ending inventory value – divided by two).
- Note: Av. DIS is NOT an average of the Remaining DIS metric. Inventory values prior to April 1, 2019 are not tracked.
- NPS: Net Promoter Score as calculated by Listen360. Article: Listen360 - Get Started with Listen360 Integration.
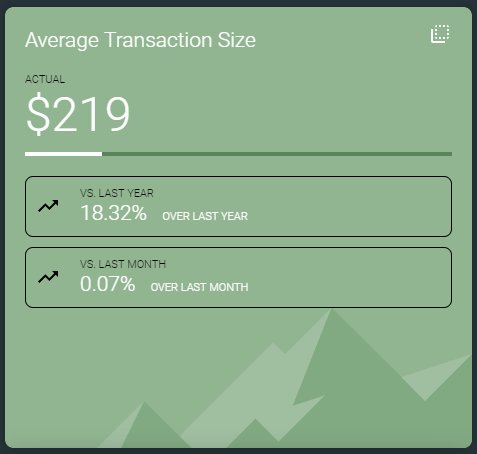
Average Transaction Size
This metric measures Sales Dollars divided by the Number of Transactions.
Note: Transactions that were finished (closed) but which did not include any sale items (e.g. cancelled layaways/work orders or gift card/certificate sales) are not included in this calculation.
To verify this number, run the following query in Ascend. Be sure to enter the date range that equals what you're looking at in Ascend HQ.
-- Average Transaction Size
SELECT [ATS]= ISNULL(((SELECT CASE WHEN SUM(Si.Quantity * Si.Price)= 0
 THEN NULL
 ELSE SUM(Si.Quantity * Si.Price)
END
 FROM SalesItems Si
JOIN Sales S ON Si.SalesID=S.ID
WHERE S.Hide=0
AND Si.Hide=0
AND S.FinishDate BETWEEN <<StartDate>> AND <<EndDate>>)
/
(SELECT COUNT(DISTINCT si.SalesID)
FROM Sales S
JOIN SalesItems si ON si.SalesID = s.ID
WHERE S.Hide=0
AND si.hide = 0
AND S.FinishDate BETWEEN <<StartDate>> AND <<EndDate>>)),0)
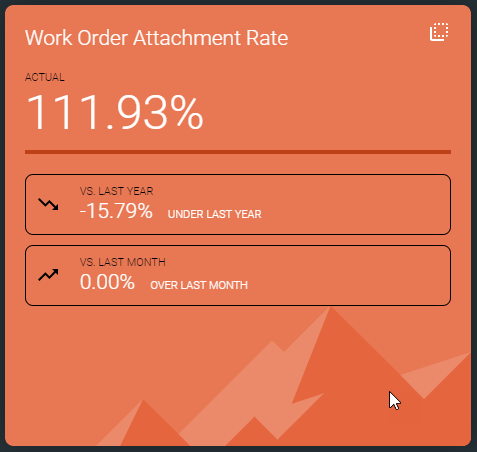
Work Order Attachment Rate
This metric measures Total Work Order Add-on Dollars divided by Total Work Order Labor Dollars and is displayed as a percentage.
Note: Work Order Add-on Dollars = Non-Labor and Non-serialized products on a Work Order with at least 1 Labor SKU
To verify this number, run the following query in Ascend.
Be sure to enter the date range that equals what you're looking at in Ascend HQ.
-- Work Order Attachment Rate
Select
 Case When w2.LaborDollars = 0 Then 0 Else Round((Cast(w2.AddonDollars as Decimal(9,2))/Cast(w2.LaborDollars as Decimal(9,2))) * 100 , 2) End As AttachmentRate
From (
Select
 Sum(w.AddonDollars) as AddonDollars,
 Sum(w.LaborDollars) as LaborDollars
From (
 Select
 Sum(Case When labCat.ID Is Not Null Then 0 Else si.Quantity * Round(si.Price, 4) End) As AddonDollars,
 s.ID,
 s.LaborDollars
 From (
 Select
 s.ID,
 Sum(si.Quantity * Round(si.Price, 4)) As LaborDollars
 From Sales s
 Join SalesItems si On si.SalesID = s.ID
 Join Products p On p.ID = si.ProductID
 Join Categories c On c.Id = p.TopicID
 Join (
 Select c.Id
 From Categories c
 Where Lower(c.Topic) Like('lab%')
 And c.Hide <> 1 And c.ParentID Is Null) labCat
 On labCat.Id = c.TopParentID Or labCat.Id = c.ID
 Where s.Hide <> 1
 And si.Hide <> 1
 And s.WorkOrder <> 0
 And s.FinishDate BETWEEN <<StartDate>> AND <<EndDate>>
 Group By s.ID) s
 Join SalesItems si On si.SalesID = s.Id
 Join Products p On p.ID = si.ProductID
 Left Join Categories c On c.ID = p.TopicID
 Left Join (
 Select c.Id
 From Categories c
 Where Lower(c.Topic) Like('lab%')
 And c.Hide <> 1 And c.ParentID Is Null) labCat
 On labCat.Id = c.TopParentID Or labCat.Id = c.ID
 Where si.Hide <> 1
 And (c.ID Is Null Or c.Serialized <> 1)
 Group By s.ID, s.LaborDollars) w) w2
Target Categories
A Target Category is a key category of the business. Right now, the two Target Categories that we measure are Labor and Bikes. Soon, retailers will be able to define their own Target Categories. The following metrics will be displayed for each designated Target Category.
If you'd like to change or adjust your Target Categories, please contact Ascend Support.
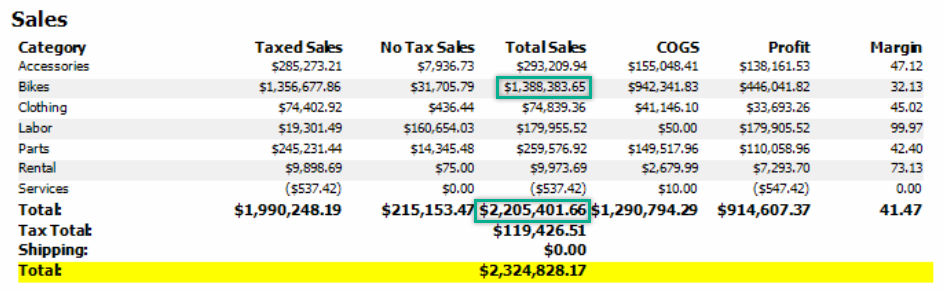
% of Total Sales
This metric measures the Total Sales Dollars in a Target Category divided by Total Sales from all categories and is displayed as a percentage.
To verify these numbers in Ascend, do the following:
- Run the Activity Summary
- Divide the Target Category Sales by Total Sales
- Example for calculating this metric can be found in the image below. In this case, the Bikes -- % of Total Sales would be 62.95%.
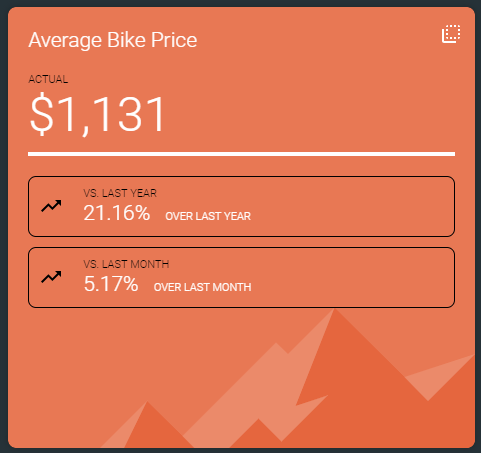
Average Price
This metric measures the Total Sales Dollars in a Target Category divided by the Units Sold the same Target Category.
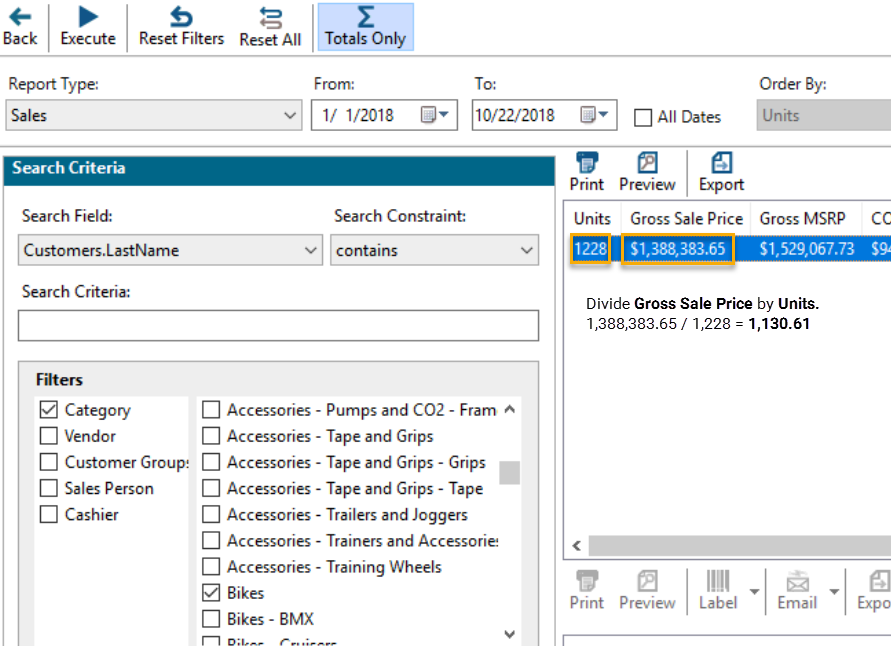
To verify Average Price in Ascend, do the following:
- In Ascend HQ, select a single location
- Set the Date Range to Year to Date
- In Ascend, go to Reports and click Prod. Query on the toolbar
- Set your From date to the first day of the calendar year
- Select the Target Category you're measuring. In this example, we'll choose Bikes.
- Click the Totals Only button on the toolbar
- Click Execute to run the Query
- Divide Gross Sale Price by Units
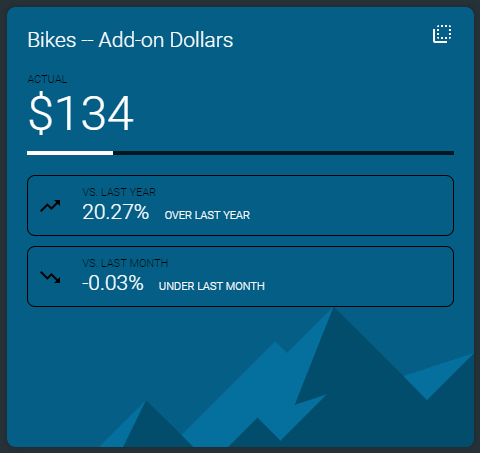
Add-on Dollars
This metric measures Total Sales Dollars (excluding Target Category, Serialized, and Labor Item ) divided by the Number of Sales containing a Target Item.
Run this query to verify your Add-on Dollars for your target category in your database.
WITH CategoryIds (CategoryId)
AS (
 -- Anchor member definition
 SELECT
 c.Id AS CategoryId
 FROM Categories c
 WHERE c.Hide <> 1
 AND Lower(c.Topic) Like(Lower(<<Category>>))
 UNION ALL
 -- Recursive member definition
 SELECT
 c.Id AS CategoryId
 FROM Categories c
 JOIN CategoryIds ci ON ci.CategoryId = c.ParentId
 WHERE c.Hide <> 1
)

SELECT
 IsNull(Sum(si.Quantity * Round(si.Price, 2)), 0) / (
 Select
 ISNULL(SUM(si.Quantity), 1) AS TargetsSold
 From Sales s
 Join SalesItems si On si.SalesID = s.ID
 Join Products p On p.ID = si.ProductID
 Join CategoryIds c ON c.CategoryId = p.TopicID
 Where s.Hide <> 1
 And si.Hide <> 1
 And s.FinishDate BETWEEN <<StartDate>> AND <<EndDate>>) AS AverageAddOnDollars
FROM (
 Select Distinct
 s.Id
 From Sales s
 Join SalesItems si On si.SalesID = s.ID
 Join Products p On p.ID = si.ProductID
 Join CategoryIds c ON c.CategoryId = p.TopicID
 Where s.Hide <> 1
 And si.Hide <> 1
 And s.FinishDate BETWEEN <<StartDate>> AND <<EndDate>>) s
Join SalesItems si On si.SalesID = s.Id
Join Products p On p.ID = si.ProductID
Left Join Categories c On c.Id = p.TopicID
Left Join (
 Select c.Id
 From Categories c
 Where Lower(c.Topic) Like('lab%')
 And c.Hide <> 1 And c.ParentID Is Null) labCat
 On labCat.Id = c.TopParentID Or labCat.Id = c.ID
Left Join CategoryIds cc On cc.CategoryId = p.TopicID
Where labCat.ID Is Null
And (c.ID IS null Or c.Serialized <> 1)
And cc.CategoryId Is Null
And si.Hide <> 1
KB22-214